
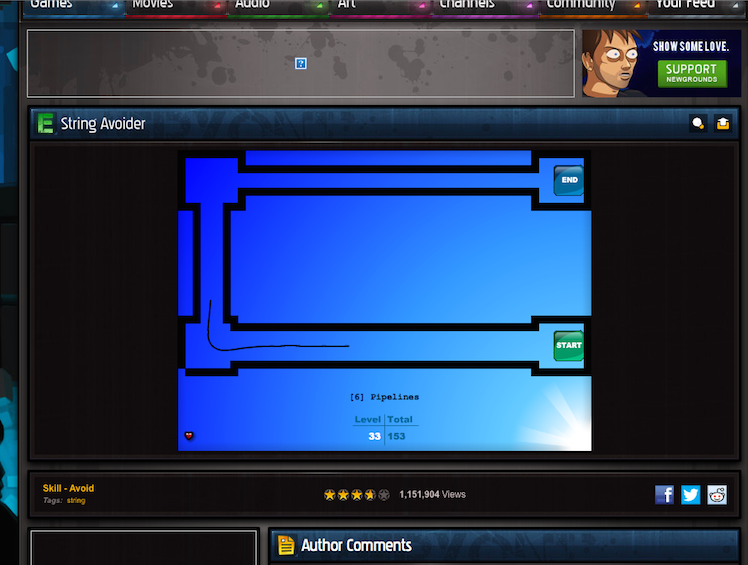
HTML5版的String Avoider小游戏
HTML5版的String Avoider小游戏 http://www.newgrounds.com/portal/view/300760 蛮简单也蛮考验耐心,从游戏起始点移动鼠标到终点位置,鼠标移动过程绘制出移动轨迹的String平滑曲线,整个过程不能碰撞到边界,从技术角度来说其核心就是根据鼠标移动位置生成String线的算法,该游戏是ActionScript写的Flash版,这里将其改造成HTML5版的JavaScript实现,并增加可自定义关卡功能的一种设计思路。
String连线我是缓存了300个点信息的数组,鼠标移动时不断调整300个点的新位置信息,每次更新时先将新鼠标点设置给第一个元素,后续更新x点时,计算其与x-1点的角度,在此方向长度为1的位置更新坐标,这样就达到了平滑曲线的效果。
除了绘制String线外还有个技术点就是监测碰撞,该Flash游戏的边界都是线段,因此第一想到的监测方式就是线线相交的思路,算法可参考 http://en.wikipedia.org/wiki/Line%E2%80%93line_intersection ,如果以LineLine的相交思路只需要遍历所有point间的线段,判断是否与游戏关卡定义的边界线相交,但这种方式对不规则边界就比较麻烦,监测性能也不高。
考虑到我们还需要提供用户可DIY自定义游戏关卡的功能,我们将采用监测颜色透明度信息的方式,由于正常游戏时场景无需用户动态修改,因此边界的信息可提前缓存到ImageData内存中,并且我们300个点的距离都是1,监测只需根据点进行就可以。
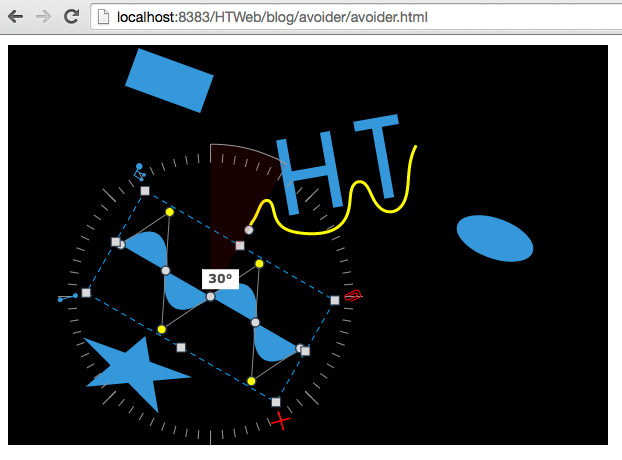
整个程序采用HT for Web的GraphView拓扑图组件,再其上通过addTopPainter添加顶层画笔绘制曲线,当曲线碰到Node图元时绘制成红色,否则绘制成黄色,监听GraphView拓扑图的interaction事件,在该事件中设置dirty的脏标志,在绘制时根据dirty的标志进行更新,采用这样的方式可将多次变换最终聚合成一次更新,这也是图形刷新绘制常用的基本技巧。同时通过GraphView.setEditable(true)开启了拓扑图的可视化编辑功能,用户可随时改变界面图元位置和旋转等形状信息,相当于自定义关卡的效果。
所有代码和运行效果如下:http://v.youku.com/v_show/id_XODU4NzY5MzQ0.html
function init(){
    dataModel = new ht.DataModel();
    graphView = new ht.graph.GraphView(dataModel);
    graphView.handleScroll = function(){};
    graphView.setEditable(true);
    graphView.setPannable(false)

    view = graphView.getView();
    view.style.left = ‘10px‘;
    view.style.top = ‘10px‘;
    view.style.width = ‘600px‘;
    view.style.height = ‘400px‘;
    view.style.background = ‘black‘;
    document.body.appendChild(view);

    createNode(20, 20, 80, 40, ‘rect‘);
    createNode(200, 300, 80, 40, ‘star‘);
    createNode(400, 100, 80, 40, ‘oval‘);
    createShape();

    length = 1;
    count = 300;
    points = [];
    for(var i=0; i<count; i++){
        points.push({x: 0, y: 0});
    }
    view.addEventListener(‘mousemove‘, function(e){
        var point = graphView.lp(e);
        points[0].x = point.x;
        points[0].y = point.y;
        for (var i = 1; i < count - 1; i++) {
            var angle = Math.atan2(points[i].y - points[i - 1].y, points[i].x - points[i - 1].x);
            points[i].x = points[i - 1].x + length * Math.cos(angle);
            points[i].y = points[i - 1].y + length * Math.sin(angle);
        }
        if(imageData){
            hit = false;
            for (var i = 0; i < count; i++) {
                var x = Math.floor(points[i].x);
                var y = Math.floor(points[i].y);
                var index = (y * graphView.getWidth() + x) * 4;
                if(imageData.data[index+3] !== 0){
                    hit = true;
                    break;
                }
            }
        }
        graphView.redraw();
    });

    dirty = true;
    imageData = null;
    graphView.mi(function(e){
        dirty = true;
    });
    graphView.addTopPainter(function(g){
        if(dirty){
            dirty = false;
            hit = false;
            imageData = g.getImageData(0, 0, graphView.getWidth(), graphView.getHeight());
            ht.Default.callLater(graphView.redraw, graphView);
        }else{
            g.beginPath();
            g.lineWidth = 3;
            g.strokeStyle = hit ? ‘red‘ : ‘yellow‘;
            g.moveTo(points[0].x, points[0].y);
            for (var i = 1; i < count - 1; i++) {
                g.lineTo(points[i].x, points[i].y);
            }
            g.stroke();
        }
    });
}
function createNode(x, y, w, h, shape){
    var node = new ht.Node();
    node.setRect(x, y, w, h);
    node.s({
        ‘shape‘: shape,
        ‘select.width‘: 0
    });
    dataModel.add(node);
    return node;
}
郑重声明:本站内容如果来自互联网及其他传播媒体,其版权均属原媒体及文章作者所有。转载目的在于传递更多信息及用于网络分享,并不代表本站赞同其观点和对其真实性负责,也不构成任何其他建议。


