
android traceview简介
Traceview是android平台配备的一个很好的性能分析工具。它可以通过图形化的方式让我们了解我们要跟踪的程序的性能,并且能具体到method。
进行Traceview的版本限制
对于Android 1.5及以下的版本:不支持。
对于Android 1.5以上2.1下(含2.1)的版本:受限支持。trace文件只能生成到SD卡,且必须在程序中加入代码。
对于Android 2.2上(含2.2)的版本:全支持。可以不用SD卡,不用在程序中加代码,直接自己用DDMS就可以进程Traceview。
一、Android 1.5以上2.1下(含2.1)的版本中Traceview的使用
首先,必须在程序当中加入代码,以便生成trace文件,有了这个trace文件我们才可以将其转化为图形。
1.1、启动追踪
使用Debug的以下静态方法方法来启动:
static void startMethodTracing(String traceName)
Start method tracing, specifying the trace log file name.
使用指定trace文件的名字和默认最大容量(8M)的方式开始方法的追踪
static void startMethodTracing()
Start method tracing with default log name and buffer size.
使用默认trace文件的名字(dmtrace.trace)和默认最大容量(8M)的方式开始方法的追踪
static void startMethodTracing(String traceName, int bufferSize, int flags)
Start method tracing, specifying the trace log file name and the buffer size.
使用指定trace文件的名字和最大容量的方式开始方法的追踪。并可指定flags.
注:int flags好像没意义。一般都用0.
static void startMethodTracing(String traceName, int bufferSize)
Start method tracing, specifying the trace log file name and the buffer size.
使用指定trace文件的名字和最大容量的方式开始方法的追踪。
注1:以上的方法的文件都会创建于SD卡下,即"/sdcard/"下,对默认文件名的就是"/sdcard/dmtrace.trace"
如果没SD卡,以上方法会抛异常致使程序crash.
注2:如果文件名没有指定类型,系统为其加上类型.trace
1.2、停止追踪
使用Debug的静态方法方法来停止:
public static void stopMethodTracing ()。
例如在activity的onCreate()中添加Debug.startMethodTracing(), 而在onDestroy()中添加Debug.stopMethodTracing(),
如下:
@Override
public void onCreate(Bundle savedInstanceState) {
Debug.startMethodTracing();
super.onCreate(savedInstanceState);
..............................
}
protected void onDestroy() {
super.onDestroy();
.................
Debug.stopMethodTracing();
}
对于模拟器我们还得创建一个带有SD card的AVD,这样才能使trace文件保存到/sdcard/...当中。
可以在命令中分别单独创建,也可以在创建avd的时候一起将sdcard创建。创建之后通过DDMS file explore我们就可以看到/sdcard/目录下有一个trace文件,如果没有在Debug语句中设置名字则默认为dmtrace.trace.
1.3、 把trace文件从SD卡拷到电脑上
现在我们把这个文件copy到我们的电脑上指定的目录:
adb pull /sdcard/dmtrace.trace d:
1.4、启动traceview可视界面
现在就可以通过命令行来执行traceview了。进入SDK的tools目录后,执行traceview,如下:
traceview D:\dmtrace.trace.
之后即可以看到图形界面了。
1.5、分析traceview结果
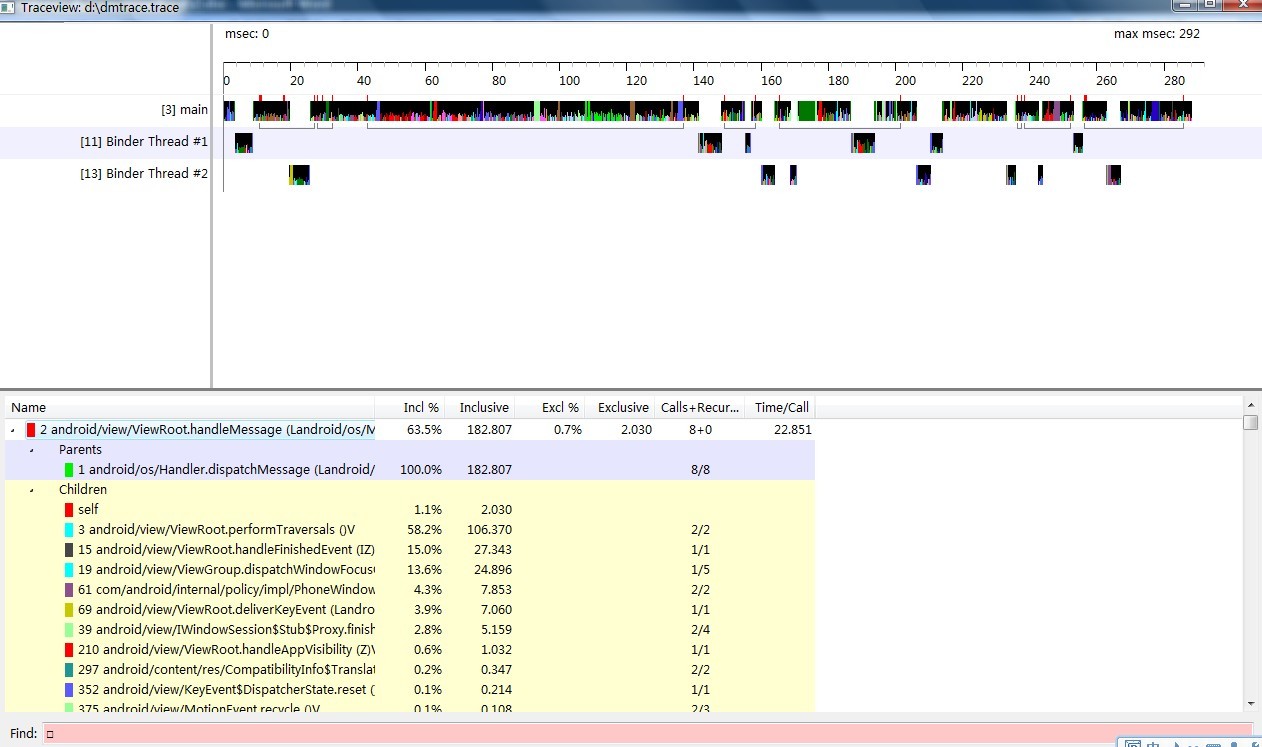
Timeline Panel
窗口的上半部分是时间轴面图(Timeline Panel)
The image below shows a close up of the timeline panel. Each thread’s execution is shown in its own row, with time increasing to the right.
Each method is shown in another color (colors are reused in a round-robin fashion starting with the methods that have the most inclusive time).
The thin lines underneath the first row show the extent (entry to exit) of all the calls to the selected method.
界面上方的尺子代表了MethodTracing的时间段(从Debug.startMethodTracing()到Debug.stopMethodTracing()的时间)。
每个线程的函数执行时间图处于和线程名同一行的右侧。
注1:线宽度代表执行该函数本身操作所用的时间。
注2:函数所调用的子函数时间线夹杂在该函数本身操作所用的时间线之间。
注3:时间线的高度不知道有什么意义。
注4:函数本身是嵌套的。
注5:每行下面粗的线段标注了Profile Panel中被选中函数调用所消耗的时间段。每个线段对应一次函数的运行。
在下面的图中我们可以看到有11次对LoadListener.nativeFinished()的调用,其中有一次调用耗时特别的多。这里的11次和图2并不一致,应该是google的疏忽。
图1The Traceview Timeline Panel
Profile Panel
窗口的下半界面是对各个函数调用的汇总图Profile Panel
Figure 2 shows the profile pane, a summary of all the time spent in a method.
The table shows both the inclusive and exclusive times (as well as the percentage of the total time).
Exclusive time is the time spent in the method.
Inclusive time is the time spent in the method plus the time spent in any called functions.
We refer to calling methods as "parents" and called methods as "children." When a method is selected (by clicking on it),
it expands to show the parents and children. Parents are shown with a purple background and children with a yellow background.
The last column in the table shows the number of calls to this method plus the number of recursive calls.
The last column shows the number of calls out of the total number of calls made to that method.
In this view, we can see that there were 14 calls to LoadListener.nativeFinished();
looking at the timeline panel shows that one of those calls took an unusually long time.
图2是对各个函数调用的汇总图Profile Panel。该表给出了the inclusive and exclusive times及他们所占有的百分比。
Exclusive time是该函数本身基本操作(不包括子函数调用)的时间。
Inclusive time是该函数调用所用的时间(包括子函数调用)的时间。
列1:"Name"表示函数名。
双击函数名,可以看到在上半界面是时间轴面图(Timeline Panel)看他的所消耗的时间段。(用粗的线段标注)。
双击函数名左边的"+"展开后可以看到,该函数的"parents"和"children"
列2:"incl%"表示函数的Inclusive time在整个MethodTracing时间里占的百分比。
列3:"Inclusive"表示Inclusive time。
列4:"Excl%"表示函数的Exclusive time在整个MethodTracing时间里占的百分比。
列5:"Exclusive"表示Exclusive time。
列6:"Calls+RecurCalls/Total"表示对函数的调用次数(包括递归调用)。如图2的nativeFinished()那列为"14+0"表示14次非递归调用,0次递归调用.
列7:新的版本(比如2.1)还有"time/calls"表示平均的调用时间(即Inclusive time/ total calls)。如图3。来自google文档的图2感觉有老了。
注:如果函数A调用函数B那么函数A称为函数B的"parents",函数B称为函数A的"children."
以下是翻译
| 英语 | 中文 |
| Incl | 调用方法占用时间百分比 |
| Inclusive | 调用方法时间(ms)(包括了所有方法的调用) |
| Excl | 执行方法占用时间百分比 |
| Exclusive | 执行方法占用时间(ms)(不包括子方法的调用) |
| Calls+Recur Calls/Total | 调用和重复调用的次数 |
| Time/Call | 总的时间(ms) |
图2:Profile Panel
图3:Profile Panel
二、Android 2.2以上(含2.2)的版本中Traceview的简化使用。
Android 2.2除了像2.1当中那样使用Traceview,还可以在DDMS使用Traceview,比以前简化的不少。
* The trace log files are streamed directly to your development machine.
在Android 2.2后可以不用SD卡。Traceview文件流是直接指向开发调试的主机(即DDMS所在的电脑)
To start method profiling:
1. On the Devices tab, select the process that you want to enable method profiling for.
2. Click the Start Method Profiling button.
3. Interact with your application to start the methods that you want to profile.
4. Click the Stop Method Profiling button. DDMS stops profiling your application and opens Traceview with the method profiling information that was collected between the time you clicked on Start Method Profiling and Stop Method Profiling.
在DDMS中如何进行Traceview。
1,在设备表中选中你想进行method trace的进程。
2,单击Method Profiling按钮开始method trace。该按钮在窗口的左上方,它在"stop"按钮的左方,"Device菜单的正下方"。
3,method trace进行中。
4,单击Method Profiling按钮停止method trace。紧接着系统会自动弹出Traceview窗口来显示刚才的method trace结果。
三、Traceview文件格式
关于Traceview文件格式请参照http://developer.android.com/guide/developing/debugging/debugging-tracing.html
四、TraceView工具使用方法
TraceView有三种启动方式,下面逐一介绍:
1、 代码中启动
可以在代码中添加
Debug.startMethodTracing(“Tracelog”);
Debug.stopMethodTracing();
使用这种方式需要确保应用的AndroidMainfest.xml中的SD卡的读写权限是打开的,即
应用运行完后,会在SD卡下生成一个Tracelog文件,使用adb pull把这个文件拷贝至XP系统上,再在android sdk的tools目录下执行traceview Tracelog,则会弹出一个图形界面,通过这个图形界面就可以分析出应用的性能瓶颈;
2、 Eclipse中启动
Eclipse启动traceview及其简单,在DDMS中对需要分析的应用进程点击如下按钮
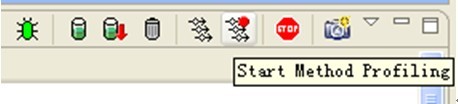
在需要停止traceview的地方点击相同的按钮,则Eclipse会自动弹出类似1中的一个图形界面;
3、 adb 命令行启动
adb shell am profile start
adb shell am profile stop
PROCESS_ID为应用的进程号,可以用ps命令获取,TRACE_FILE为需要存储的Trcaelog文件。
执行上面的命令后,会生成对应的TRACE_FILE,使用adb pull把这个文件拷贝至XP系统上,再在android sdk的tools目录下执行traceview Tracelog,则会弹出一个图形界面,通过这个图形界面就可以分析出应用的性能瓶颈;
本文参照来源:
http://wbdban.javaeye.com/blog/564309
http://developer.android.com/guide/developing/debugging/debugging-tracing.html
http://developer.android.com/guide/developing/debugging/ddms.html#profiling
郑重声明:本站内容如果来自互联网及其他传播媒体,其版权均属原媒体及文章作者所有。转载目的在于传递更多信息及用于网络分享,并不代表本站赞同其观点和对其真实性负责,也不构成任何其他建议。


